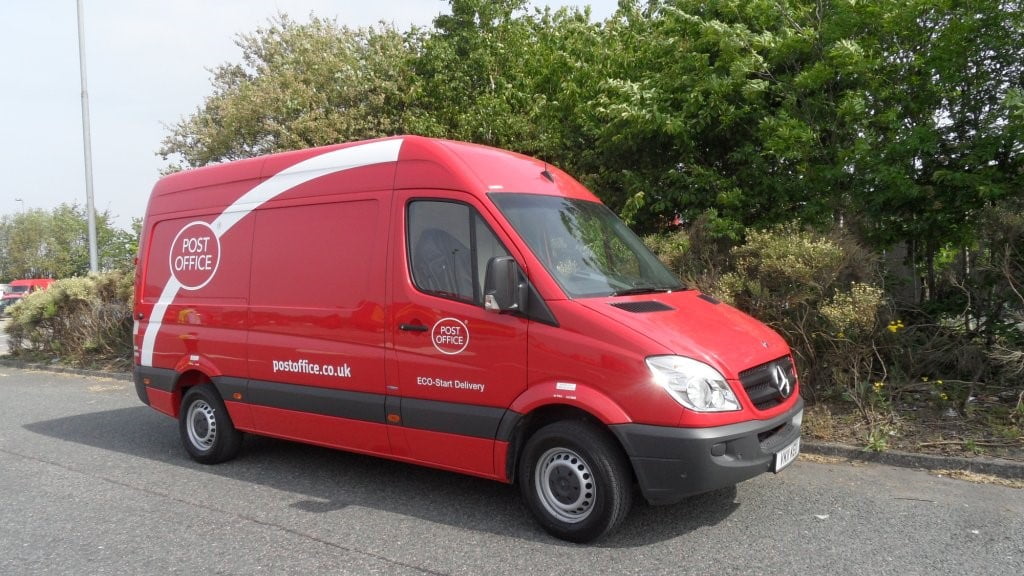
In 2017/18, the Post Office’s cash-in-transit fleet recorded an average of 20.6 miles per gallon (mpg). The fleet was equipped with basic telematics used for tracking and vehicle locating purposes. Although drivers were aware of the presence of telematics, there was no direct interaction with the data and no regular means of receiving feedback through the system.
Background
The process
The Post Office introduced the MiX Telematics RIBAS system in 2018/19, which uses a basic in-cab display that highlights incidents of over-revving, excessive idling, harsh braking, harsh acceleration, and speeding. The unobtrusive system ensures that drivers are alerted to any of these behaviours as they occur and provides access to an app that gives feedback on their driving style. Management data also means line managers can see performance on a weekly basis and can proactively discuss results with the drivers.

Results
Overall, the cash-in-transit fleet has saved 232 tonnes of carbon dioxide (CO2) per year. Since adopting the MiX RIBAS Telematics system, the fleet’s average miles per gallon (mpg) improved by 11.8% between 2017/18 and 2020/21. Further improvements have been evident in 2020/21 with the setting of bonus-worthy objectives for area and shift managers to boost figures. However, due to operational and traffic changes during the Covid-19 pandemic, it is not possible to accurately attribute all of this further improvement to the changes, although undoubtedly they have contributed significantly to this.
By adopting the RIBAS system, the fleet average mpg improved by 5.3% between 2017/18 and 2018/19 with the same set of vehicles. This further improved for 2019/20, giving an overall improvement of 6.3% between 2017/18 and 2019/20.
| Cash-in-transit fleet | 2017/18 | 2018/19 | 2019/20 | 2020/21 |
|---|---|---|---|---|
| Annual mileage | 4,984,836 | 5,088,711 | 4,875,019 | 4,602,496 |
| Litres used | 1,099,808 | 1,064,906 | 1,010,308 | 909,046 |
| Gallons used | 241,846 | 234,247 | 222,237 | 199,962 |
| Emissions tonnes | 2,852 | 2,762 | 2,620 | 2,358.17 |
| Average mpg | 20.61 | 21.72 | 21.91 | 23.02 |
| % Increase in MPG | N/A | 5.3% | 1.1% | 4.9% |
